Irrigation Water Quality for Sports Turf
by Jerry Spencer, Principal Agronomist at Gilba Solutions. BSc (Hons) Soil Science, Newcastle Upon Tyne. Former STRI agronomist. Author of Nutrition of Sports Turf in Australia (CSIRO / Landlinks Press). 35+ years advising on golf, stadia and council sports turf across Australia, New Zealand, the UK and Europe. See case studies of past client work.
Published: 18 May 2026
Irrigation water quality is the single most underweighted input in sports turf agronomy. On most sites the water source is treated as a fixed variable. It is not. The chemistry of the water moving through the rootzone every week shapes soil structure, infiltration, nutrient availability, and turf response to every other input applied to the surface.
Sodium, bicarbonate, chloride, boron and total salt load all interact with the rootzone over time. A water source that runs fine through a soil-based profile can degrade a sand-based USGA green in two seasons. Recycled and bore water in particular need active management, because the chemistry rarely sits within the comfort range for high-performance turf.
This pillar covers the parameters that matter, the thresholds that define risk, and the treatment options that work. It draws on FAO-29 (Ayers and Westcot 1985), Carrow and Duncan’s salinity work, and Australian and New Zealand guideline values (ANZECC 2000, ANZG 2018), applied to the rootzones we actually manage in golf, stadium and council turf.
For site-specific interpretation against MLSN, soil structure and turf species, the GAIP Hub integrates water quality analysis with soil chemistry and irrigation programming in one platform. See also the Soil and Rootzone Science pillar for how water chemistry interacts with the soil profile.
What This Topic Covers
Salinity (EC and TDS)
Total soluble salt load in irrigation water, is measured as electrical conductivity (EC) or total dissolved solids (TDS). This affects osmotic stress on roots, surface salt build-up, and the leaching fraction you need to keep the rootzone in balance.
- EC and TDS thresholds for turf species
- Osmotic stress and root function
- Leaching fraction maths
- Surface salt build-up and recovery
Sodicity (SAR and adjusted SAR)
Sodium adsorption ratio measures sodium hazard relative to calcium and magnesium. SAR drives clay and colloid dispersion, which destroys soil structure and reduces drainage over time. Adjusted SAR (adj SAR) corrects for bicarbonate-driven calcium precipitation.
- SAR and adjusted SAR maths
- FAO-29 infiltration risk thresholds
- Exchangeable sodium percentage (ESP)
- Gypsum as a sodium countermeasure
Alkalinity (Bicarbonate, Carbonate, RSC)
Bicarbonate and carbonate ions in irrigation water raise the soil pH over time, precipitate soluble calcium, and worsen the effective sodium hazard. Residual sodium carbonate (RSC) quantifies this.
- Bicarbonate thresholds and pH drift
- Residual sodium carbonate (RSC) interpretation
- Acid injection programs
- Interaction with foliar calcium and iron uptake
Specific Ion Toxicity (Chloride, Boron, Sodium)
Chloride, boron and sodium can each accumulate to toxic levels in plant tissue even when bulk salinity sits within acceptable range. Each ion has different uptake pathways, thresholds and symptoms.
- Chloride build-up and leaf burn
- Boron toxicity in low-rainfall regions
- Sodium toxicity in foliar contact irrigation
- Species and cultivar tolerance differences
Reclaimed and Recycled Water
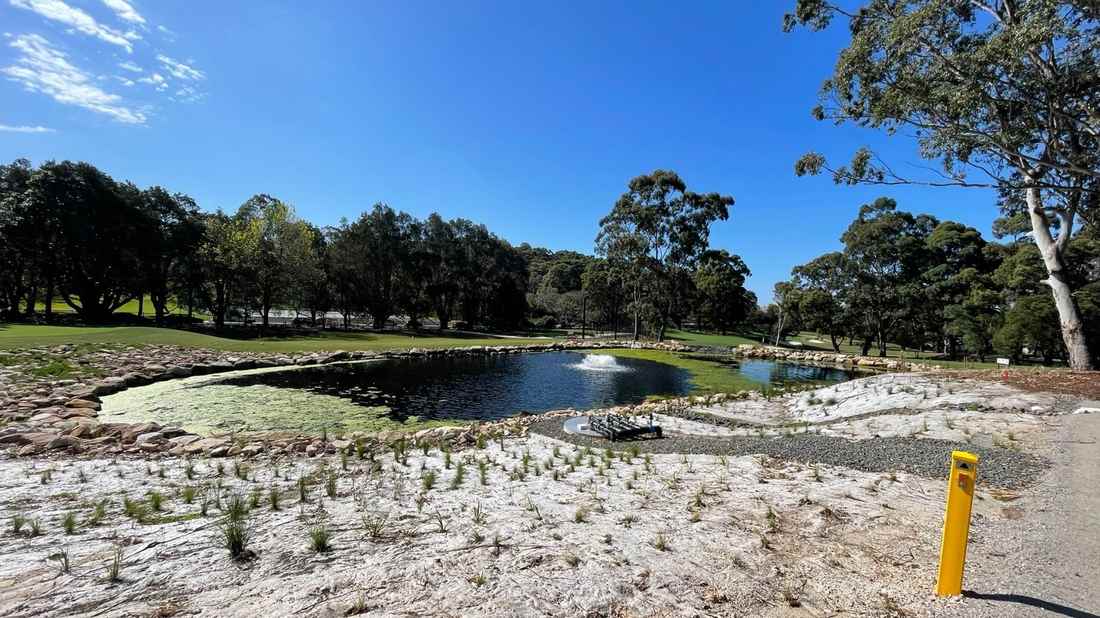
Treated effluent, stormwater capture and dam water carry nutrient loads, biological contaminants and variable chemistry that recur on a regular basis. Nitrogen, phosphorus and potassium loads change the fertiliser program. Faecal indicator organisms drive compliance and access restrictions. For a worked example, see our Twin Creeks blue-green algae case study covering cyanobacteria management in a golf course irrigation storage dam.
- Nutrient loads from recycled water
- Pathogen and indicator organism monitoring
- Class A vs Class B effluent water in Australia
- Storage and aeration of recycled water
Treatment, Monitoring and Compliance
Treatment options range from blending and acid injection through to reverse osmosis. Each has a cost-benefit position. Routine monitoring frequency depends on source type, season and risk profile.
- Acid injection (sulphuric, and urea-sulphuric)
- Gypsum injection and dissolution rates
- Blending with a second source
- Reverse osmosis and salty water filtration
- Testing frequency and lab selection
- Work out your turf’s water requirement with our Australian turf irrigation calculator
- Which is the right wetting agent for you? Use our soil wetting agent tool.
What parameters define irrigation water quality for turf?
Irrigation water quality is defined by five interacting groups, and not a single number. For example, water can sit within range for total salt content but fail on sodium hazard, or pass on sodium but cause pH drift through bicarbonate build-up.
The five groups are:
- Salinity: electrical conductivity (EC) in dS/m or mS/cm, and total dissolved solids (TDS) in ppm or mg/L. This is a measure of the total soluble salt load, and drives osmotic stress and salt build-up.
- Sodicity: sodium adsorption ratio (SAR), adjusted SAR (adj SAR), and the sodium percentage of total cations. This drives clay and colloid dispersion over time.
- Alkalinity: bicarbonate (HCO3–), carbonate (CO32-), and residual sodium carbonate (RSC). Drives soil pH and worsens the sodium hazard as it precipitates calcium out of solution.
- Specific ion toxicity: chloride (Cl–), boron (B), and sodium (Na+) as a foliar contact ion. Each builds-up to toxic levels in plant tissue at different thresholds.
- Nutrient and biological load: nitrogen, phosphorus, potassium, sulphur, iron, and faecal coliforms.
Where infiltration into a hydrophobic or sand-based rootzone is a problem, consider the use of surfactants. See the soil wetting agent selector for how to match surfactants to the soil and season.
FAO Irrigation and Drainage Paper 29 (Ayers and Westcot 1985) is the foundation for this. It groups water into “no restriction”, “slight to moderate restriction”, and “severe restriction” bands. ANZECC 2000 and the more recent ANZG 2018 provide Australia and New Zealand context. Carrow and Duncan (2012) then extend the framework specifically to high-performance turf.
A useful water test for sports turf includes EC, pH, Ca, Mg, Na, K, HCO3, CO3, Cl, SO4, B, Fe, Mn, and total N. From these values you can calculate SAR, adj SAR and RSC.
What is SAR and why does it matter for soil structure?
Sodium adsorption ratio (SAR) compares the sodium concentration in water to the concentration of calcium and magnesium. The formula is:
SAR = Na / √((Ca + Mg) / 2)
All concentrations are in milliequivalents per litre (meq/L). In effect, SAR puts a number on sodium hazard relative to the two cations that flocculate soil colloids and hold soil aggregates together.
Specifically, sodium destabilises soil structure through dispersion. As sodium builds up on cation exchange sites in the rootzone, it pushes off calcium and magnesium and weakens the bonds that hold clay, silt and organic colloids in aggregate form. Then, the dispersed fines migrate and block pore spaces. As a result, infiltration falls, hydraulic conductivity drops, and oxygen diffusion to the roots is reduced.
SAR Thresholds
FAO-29 thresholds for SAR are:
- SAR below 3: no restriction on most soils
- SAR 3 to 6: slight to moderate restriction, so monitor closely on sand-based rootzones
- SAR 6 to 12: moderate to severe restriction
- SAR above 12: severe restriction, with structural damage likely unless actively managed
However, two caveats matter. First, the SAR risk band shifts with the EC of the water. In particular, low-EC water (below 0.5 dS/m) makes dispersion worse at any given SAR, because there isn’t enough salt to keep the colloids flocculated. For that reason, soft rainfall after high-sodium irrigation often triggers the worst drop in infiltration, which is the opposite of what many people expect.
Second, adjusted SAR (adj SAR) corrects for bicarbonate-driven calcium precipitation. That is, bicarbonate in irrigation water reacts with soluble calcium and removes it from solution as calcium carbonate. Consequently, the effective SAR rises even when the raw calcium and sodium values look acceptable. For that reason, adj SAR (Suarez 1981 method) is the more useful number when bicarbonate is above 2 meq/L.
For management, use calcium-based amendments (gypsum), acidification where bicarbonate is high, drainage for leaching, and active management of water quality through blending or treatment.
How does bicarbonate affect soil and turf health?
Bicarbonate (HCO3–) drives three distinct problems and over time these tend to worsen.
Soil pH drift
Bicarbonate is alkali, and each time you irrigate it adds to the rootzone. Over time the soil pH rises, and on sand-based profiles with low CEC and buffering capacity, this pH increase can be fast. When this happens iron and manganese availability falls, phosphorus locks up as calcium phosphate, and root function declines.
Calcium precipitation
Bicarbonate reacts with soluble calcium in the water and in the rootzone to form calcium carbonate (CaCO3, lime). The reaction is:
Ca2+ + 2HCO3– → CaCO3 + CO2 + H2O
The soluble calcium that should be available to displace sodium from cation exchange sites is now insoluble. Effective SAR rises even when the calcium level looks adequate. This is why adjusted SAR (adj SAR) is a more useful number when bicarbonate levels are greater than 2 meq/L.
Surface scaling
Calcium carbonate builds up on irrigation system components, nozzles, and leaf surfaces.
FAO-29 thresholds for bicarbonate are:
- HCO3 below 1.5 meq/L (90 ppm): no restriction
- HCO3 1.5 to 8.5 meq/L (90 to 520 ppm): slight to moderate restriction, monitor pH drift
- HCO3 above 8.5 meq/L (520 ppm): severe restriction, active treatment needed
Treatment is with acid injection, and requires you to monitor, manage the pH, and have the right safety infrastructure. Sulphur burners are a slow acting option and produce sulphurous acid. Gypsum injection adds calcium to the water and helps where SAR and bicarbonate are high. It does not however lower the pH.
For sites without acid injection, ammonium thiosulphate (ATS) and potassium thiosulphate (KTS) deliver soluble sulphur. This oxidises to sulphate and acidifies the soil over time, and offers a slower, low-risk pathway to manage bicarbonate. See sulphur in plants and turfgrass for ATS and KTS chemistry.
What EC and TDS thresholds apply to turf irrigation?
Electrical conductivity (EC) measures the total soluble salts in irrigation water in units of dS/m or mS/cm. Note that the two are numerically identical. The older measure is total dissolved solids (TDS), reported in ppm or mg/L. As a rough conversion, TDS (ppm) = EC (dS/m) × 640, though the factor varies with the salt composition.
In effect, salinity creates osmotic stress on roots. That is, the higher the rootzone salt concentration, the harder roots have to work to extract water. Above a species-specific threshold, the turf will wilt even when soil moisture readings seem fine. Importantly, the threshold differs sharply between cool and warm-season species, and also between varieties within each group.
FAO-29 thresholds for irrigation water EC are:
- EC below 0.7 dS/m (450 ppm TDS): no limits for most crops
- EC 0.7 to 3.0 dS/m (450 to 2000 ppm TDS): slight to moderate limits
- EC above 3.0 dS/m (2000 ppm TDS): severe limits
Turf Salinity Thresholds
For turf, Carrow and Duncan (2012) give salinity ranges by species. Approximate threshold EC for irrigation water is:
- Winter grass, colonial bentgrass, fine fescues: above 1.5 dS/m starts to limit growth
- Creeping bentgrass, perennial ryegrass, Kentucky bluegrass, tall fescue: tolerate up to 3.0 dS/m with active leaching
- Couch / bermudagrass, kikuyu, zoysia: tolerate 3.0 to 6.0 dS/m with good drainage
- Seashore paspalum: tolerates above 6.0 dS/m
By comparison, ANZECC 2000 guidelines for general agriculture sit at 0.65 dS/m for sensitive crops and 1.3 dS/m for moderately tolerant crops.
The leaching fraction (LF) is the amount of irrigation that drains below the rootzone and carries dissolved salts with it. You can calculate it from the water EC and target soil saturated paste EC (ECe):
LF = ECiw / (5 × ECe − ECiw)
Here, ECiw is irrigation water EC and ECe is the target saturated paste EC for the species. In short, a high LF means you need to apply more water than the plant needs, in order to flush salt from the profile. For example, on a sand rootzone with ECiw of 2.0 dS/m and a target ECe of 4.0 dS/m for couch, LF is around 11% of irrigation draining below the root zone. While this is achievable on sand, it is less so on poorly draining soil.
On top of that, fertiliser salt index also adds to the salt load. So on sand greens with marginal-EC irrigation, switching to low-salt N sources (UF or methylene urea) reduces this load. For nutrient labelling conventions and salt index ranking, see the turf fertiliser overview.
Finally, surface salt causes chlorosis and dieback, worst at the irrigation edges. To recover, leach with low-EC water, or run deep flushes with the existing source on a calculated LF basis.
How is residual sodium carbonate (RSC) interpreted?
Residual sodium carbonate (RSC) is the combined effect of bicarbonate and carbonate on the effective sodium hazard of irrigation water. The formula is:
RSC = (CO32- + HCO3–) – (Ca2+ + Mg2+)
All values and the result are in milliequivalents per litre (meq/L). RSC captures the fact that bicarbonate and carbonate precipitate calcium and magnesium out of solution as carbonates. This then leaves sodium as the dominant cation in the rootzone water. The higher the RSC, the more aggressive the effective sodium loading on the cation exchange sites.
RSC Thresholds
Threshold bands (Eaton 1950, FAO-29 and most national guidelines):
- RSC below 1.25 meq/L: safe for irrigation
- RSC 1.25 to 2.5 meq/L: marginal, monitor sodium build-up, expect to amend with calcium
- RSC above 2.5 meq/L: unsuitable for long-term irrigation without treatment
A negative RSC value means calcium and magnesium exceed the carbonate ions in the water. Soluble calcium remains available to displace sodium from exchange sites.
RSC is the most useful single number for diagnosing sodium hazard on water sources where the bicarbonate is high. SAR alone underestimates the risk because it does not account for the calcium that precipitates once the water enters the rootzone. Two water sources can have an identical SAR but very different RSC values, and the higher-RSC source will damage soil structure faster.
Management priorities by RSC band:
- RSC below 1.25: no specific action, routine soil testing
- RSC 1.25 to 2.5: schedule gypsum applications to maintain soluble calcium, monitor ESP in soil tests, ensure the leaching fraction is sufficient
- RSC above 2.5: acid injection to neutralise carbonate and bicarbonate, or blend with a low-RSC source, or both. Gypsum alone is not enough at this band.
RSC is one of the four numbers (EC, SAR, adj SAR, RSC) that should appear on every irrigation water analysis for sports turf. Many commercial water test reports list bicarbonate and carbonate but do not calculate RSC. Request it explicitly, or calculate from the raw values.
The downstream consequence of sodium-driven structural collapse is poor drainage and persistent anaerobic conditions in the rootzone. These then trigger denitrification, ferrous sulphide formation and root dieback. The soil aeration reference covers the anaerobic chemistry sequence in detail.
How do chloride and boron toxicity present in turf?
Chloride and boron are the two ions that can show toxicity symptoms even on turf even when the salinity sits within range. Both build-up in plant tissue over time. Both have distinct visual symptoms. Both have tolerance thresholds that vary by species and cultivar.
Chloride
Chloride enters the root by mass flow with water uptake and builds-up in leaves. Symptoms are leaf-tip burn and scorch on leaf edges. On creeping bentgrass and winter grass, you see symptoms in dry periods when transpiration is high and the leaching fraction drops.
FAO-29 thresholds for chloride in irrigation water:
- Cl below 4 meq/L (140 ppm): no limits for surface irrigation
- Cl 4 to 10 meq/L (140 to 350 ppm): slight to moderate limits
- Cl above 10 meq/L (350 ppm): severe limits
For foliar contact the thresholds run tighter because chloride enters the leaf through the cuticle:
- Cl below 3 meq/L (105 ppm): no limit with overhead irrigation
- Cl above 3 meq/L: switch to early morning irrigation, leach with the lowest-Cl source available, choose tolerant cultivars
Cool-season species sit at the sensitive end. Warm-season species tend to tolerate higher Cl loads, with seashore paspalum at the tolerant end (handles above 15 meq/L).
Boron
Turf requires Boron in trace amounts, but the gap between deficiency and toxicity is narrow. Symptoms are marginal leaf yellowing and tip dieback, which is often mistaken for drought stress or fertiliser burn. Boron does not leach easily, so it tends to build-up over multiple seasons.
FAO-29 thresholds for boron:
- B below 0.7 ppm: no limits for sensitive species
- B 0.7 to 3.0 ppm: slight to moderate limits
- B above 3.0 ppm: severe limits
Boron toxicity is most common with bore water in arid and semi-arid regions, such as parts of inland Australia, the western US and the Middle East. It also shows up in some treated effluent sources where B compounds in detergents pass through standard wastewater treatment intact.
Boron is not effectively removed by acid injection or gypsum. Treatment options are limited to reverse osmosis, blending with a low-B water source, or using tolerant species. Couch and kikuyu tolerate higher B than creeping bentgrass. Seashore paspalum is the most tolerant warm-season option.
Tissue testing is the confirmation step for both ions. Cl above 1.0% in dry leaf tissue indicates accumulation. B above 100 ppm in dry tissue indicates toxicity. Soil tests confirm whether the source is irrigation water (upper rootzone build-up) or a different source (uniform through profile).
What treatment options exist for poor-quality irrigation water?
Treatment scales with the problem and the budget. Broadly, the four main options are blending, acid injection, gypsum injection and reverse osmosis. Each one addresses different parameters and sits at a different cost point.
Blending
To start, mix the problem water with a second source of better quality. Common pairings are bore water with rainwater capture, recycled water with mains, or two bore sources of different chemistry. In effect, blending dilutes salinity, sodium and specific ions proportionally. However, it does not change bicarbonate or carbonate chemistry. To work properly, effective blending requires a holding tank or in-line mixing, along with consistent ratio control. Cost is mostly infrastructure (tank, pumps, controls), with low ongoing operating cost.
As an approximate blend calculation: if Source A is at SAR 12 and Source B is at SAR 2, a 50:50 blend lands at SAR 7. While salinity blends linearly, SAR blends approximately linearly across the practical range. Either way, verify by lab analysis after blending, not just by calculation. To make this easier, the GAIP Hub has an inbuilt calculator that does this for you.
Acid injection
Next, inject acid into the irrigation line to neutralise bicarbonate and carbonate. For large systems, sulphuric acid (98%) is the most common choice. Alternatively, urea-sulphuric (N-pHURIC 15/49, US-15) is safer to handle and adds nitrogen as a side benefit. Meanwhile, citric acid suits small systems and ornamental use. Typically, target injection rate brings irrigation water pH to between 6.0 and 6.5. In doing so, this converts bicarbonate to carbonic acid, then to CO2 and water.
In practice, acid injection requires pH monitoring, an injection pump with metering, a backflow prevention assembly, and safety infrastructure for acid storage and handling. On the running side, operating cost is the acid itself, which scales with bicarbonate load and irrigation volume. On top of that, maintenance covers the injection equipment and pH probe calibration.
Gypsum injection
Alternatively, inject finely-ground gypsum (calcium sulphate dihydrate, CaSO4·2H2O) into the irrigation stream as a slurry. In doing so, this adds soluble calcium to displace sodium from cation exchange sites and counter dispersion. However, it does not lower pH, so it does not address bicarbonate-driven alkalinity. As such, it is effective on water sources with moderate SAR (3 to 8) and bicarbonate within the manageable band.
One limit to note: solubility of gypsum in water is low (around 2.5 g/L at 25°C), which sets the upper limit on injection concentration. For that reason, slurry tanks need agitation to keep gypsum in suspension. Cost is the gypsum and the injection equipment, and operating cost is moderate.
Reverse osmosis (RO)
In contrast, reverse osmosis pushes water through a semi-permeable membrane under pressure to separate dissolved salts from water. As a result, RO removes essentially all dissolved ions, including salts, sodium, chloride, boron, bicarbonate and most nutrients. The output is near-pure water that typically needs partial blending back with the source to restore minimal salinity and nutrient content.
On cost, capital outlay is high (membranes, pumps, pretreatment filters, energy recovery devices). Operating cost is energy (pumping pressure) and membrane replacement. On top of that, reject water (the concentrated brine stream) is typically 20 to 40% of feed water and needs disposal management. For these reasons, RO is justified on golf courses with bore water of EC above 3 dS/m where alternative sources are unavailable, on coastal stadiums irrigating from brackish supply, and on sites with regulatory restrictions on alternative supplies.
Sulphur burners
Finally, sulphur burners are a slower-acting acidification alternative that combust elemental sulphur to produce sulphur dioxide, which then dissolves into irrigation water as sulphurous acid (H2SO3). Compared with concentrated acid, handling risk is lower, but pH response is slower and control less precise. Even so, they are effective on moderate bicarbonate loads.
Decision Framework For Water Treatment
As a decision framework by primary problem:
- High SAR, low bicarbonate: gypsum injection
- High bicarbonate, moderate SAR: acid injection
- High SAR, high bicarbonate: acid injection plus gypsum
- High EC across the board: blending if a second source exists, otherwise RO
- High boron: blending or RO, since no chemical treatment removes boron
- High chloride with foliar contact: switch irrigation timing, use subsurface where possible, blend if available, otherwise species selection
One more thing to watch: surface water sources (dams, creeks, harvested stormwater) carry additional risk during and after flood events. In particular, silt load, anaerobic post-flood chemistry, and herbicide-residue dilution are all relevant. For the post-flood rootzone recovery sequence, see how to manage flooded turf.

How often should irrigation water be tested, and what should the test include?
Testing frequency depends on source type, season and risk profile. To start with, recycled and surface water sources need testing because their chemistry shifts through the year. By contrast, bore and mains water sources are usually more stable, but even so they still drift.
Standard testing schedule for sports turf:
- Mains and town water: annual test, but more often if the supplier changes treatment chemistry or source
- Bore water: twice yearly (start and middle of irrigation season), and more often if drought conditions are drawing the aquifer down
- Recycled and effluent water: quarterly minimum, monthly during peak demand, and weekly biological monitoring where Class B effluent is in use
- Surface water (dam, river, stormwater capture): quarterly, plus event-based testing after major rainfall or upstream changes
- Blended water: test each source separately at the schedules above, and then test the blend after the mixing point quarterly
Testing For Irrigation Water Suitability
For sports turf, a complete irrigation water test should include:
- pH (water pH, not soil pH)
- Electrical conductivity (EC) in dS/m
- Total dissolved solids (TDS) in ppm, calculated from EC
- Cations: calcium, magnesium, sodium, potassium (meq/L and ppm)
- Anions: bicarbonate, carbonate, chloride, sulphate (meq/L and ppm)
- Boron in ppm
- Calculated indices: SAR, adjusted SAR, RSC
- Trace elements: iron and manganese (for staining and irrigation system maintenance, not just nutrition)
- Total nitrogen and total phosphorus on recycled or surface water
- Faecal indicator organisms (E. coli, enterococci) on recycled or surface water
On top of that, lab selection matters. For Australia and New Zealand, accredited labs include Hill Laboratories (NZ), Westgate (AU), APAL (SA), SWEP (VIC), and ALS Global. Meanwhile, UK options include NRM Laboratories and Sciantec, and US options include Brookside, Logan Labs and Waters Agricultural Laboratories. Either way, make sure the lab reports raw values and calculated indices in the units used here (meq/L for cations and anions, dS/m for EC).
When it comes to interpretation, pair water testing with soil testing. After all, a water source can pass on every parameter individually but still drive accumulation in the rootzone over years. For that reason, annual soil tests by depth (0 to 25 mm, 25 to 100 mm) detect accumulation early. Before changing the program, pair the water test report with soil test data, current irrigation scheduling and species tolerance.
Finally, for ongoing site-specific interpretation, the GAIP Hub integrates water quality, soil test and species data into amendment recommendations and irrigation scheduling outputs.
Key Considerations for Irrigation Water Quality
Salinity assessment
- Electrical conductivity (EC) in dS/m
- Total dissolved solids (TDS) in ppm or mg/L
- Species and cultivar salt tolerance bands
- Leaching fraction (LF) calculation against rootzone target EC
- Seasonal EC drift in bore and recycled sources
- Surface salt build-up
Sodicity assessment
- Sodium adsorption ratio (SAR) and adjusted SAR (adj SAR)
- Exchangeable sodium percentage (ESP) in the rootzone
- Low-EC dispersion risk after soft rainfall
- FAO-29 infiltration risk bands
- Gypsum source and particle size
Alkalinity and bicarbonate load
- Bicarbonate (HCO3) and carbonate (CO3) in meq/L
- Residual sodium carbonate (RSC) maths
- Acid injection target pH (6.0 to 6.5)
- Soil pH drift over the season
- Sprinkler scaling and loss of uniformity
Specific ion toxicity
- Chloride load and foliar thresholds
- Boron build-up in low-leaching profiles
- Sodium toxicity through irrigation
- Tissue test thresholds
- Species selection for ion-tolerant systems
Recycled and surface water
- Nitrogen, phosphorus and potassium load from the water source
- Aquatic weed and algae control in irrigation dams
- Class A vs Class B effluent and access restrictions
- Faecal indicator organisms
- Storage tank aeration and biofilm management
- Iron and manganese in bore water
Management drivers
- Irrigation scheduling and evapotranspiration (ET) demand
- Leaching fraction in the seasonal program
- Treatment infrastructure: blending, acid and gypsum injection, reverse osmosis
- Testing frequency by source and season
- Rootzone physics and drainage capacity
- Irrigation programming against ET
References
ANZECC and ARMCANZ (2000). Australian and New Zealand Guidelines for Fresh and Marine Water Quality.
ANZG (2018). Australian and New Zealand Guidelines for Fresh and Marine Water Quality.
Ayers, R.S. and Westcot, D.W. (1985). Water Quality for Agriculture. FAO Irrigation and Drainage Paper 29, Rev. 1. Food and Agriculture Organization of the United Nations, Rome.
Bauder, T.A., Waskom, R.M., Sutherland, P.L. and Davis, J.G. (2011). Irrigation Water Quality Criteria. Colorado State University Extension, Fact Sheet No. 0.506.
Carrow, R.N. and Duncan, R.R. (1998). Salt-Affected Turfgrass Sites: Assessment and Management.
Carrow, R.N. and Duncan, R.R. (2012). Best Management Practices for Saline and Sodic Turfgrass Soils: Assessment and Reclamation. CRC Press.
Carrow, R.N., Duncan, R.R. and Huck, M.T. (2009). Turfgrass and Landscape Irrigation Water Quality: Assessment and Management. CRC Press.
Duncan, R.R., Carrow, R.N. and Huck, M.T. (2009). Effective management of turfgrass under salinity stress. Acta Horticulturae, 783: 145-160.
Eaton, F.M. (1950). Significance of carbonates in irrigation waters. Soil Science, 69(2): 123-134.
Rhoades, J.D., Kandiah, A. and Mashali, A.M. (1992). The Use of Saline Waters for Crop Production. FAO Irrigation and Drainage Paper 48.
Spencer, J. (2007). Nutrition of Sports Turf in Australia. CSIRO Publishing / Landlinks Press.
Suarez, D.L. (1981). Relation between pHc and sodium adsorption ratio (SAR) and an alternative method of estimating SAR of soil or drainage waters. Soil Science Society of America Journal, 45(3): 469-475.
U.S. Salinity Laboratory Staff (1954). Diagnosis and Improvement of Saline and Alkali Soils. USDA Agriculture Handbook 60.
WHO (2006). Guidelines for the Safe Use of Wastewater, Excreta and Greywater.

Principal agronomist, Gilba Solutions Pty Ltd
BSc Hons Soil Science (Newcastle). Former STRI agronomist. Author of Nutrition of Sports Turf in Australia (CSIRO/Landlinks Press) and The Definitive Guide to Australian Turfgrass Pesticide Management. 35+ years advising on sports turf, golf and stadia across Australia, NZ, UK and Europe.