
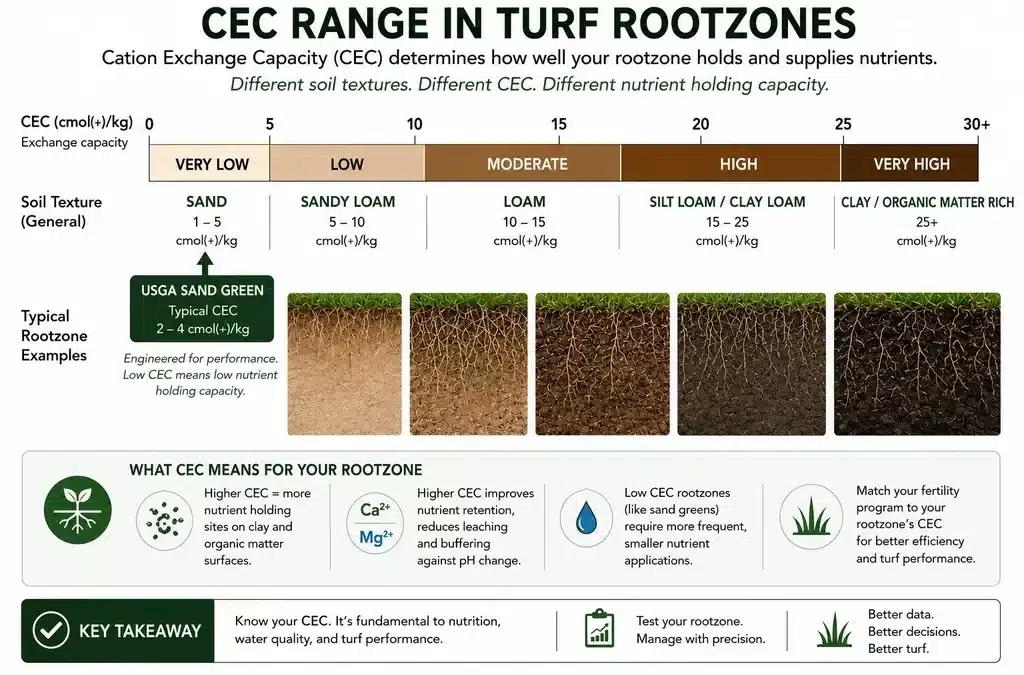
Cation exchange capacity (CEC) measures how many positively-charged nutrient ions a soil can hold on its negatively-charged surfaces. It is reported in centimoles of positive charge per kilogram of soil (cmolc/kg, formerly meq/100 g). A high CEC soil holds more K, Ca, Mg and other cations against leaching, releases them more steadily to the grass plant, and resists rapid pH change. A low CEC soil leaches cations quickly, requires more frequent fertilisation to maintain supply, and is more prone to nutrient imbalance. CEC is the single most useful summary number on an Australian turf soil test for understanding how the rootzone will behave between fertiliser applications. For sand-based turf profiles the CEC is usually low, which has direct implications for how often potassium and calcium need to be replenished.
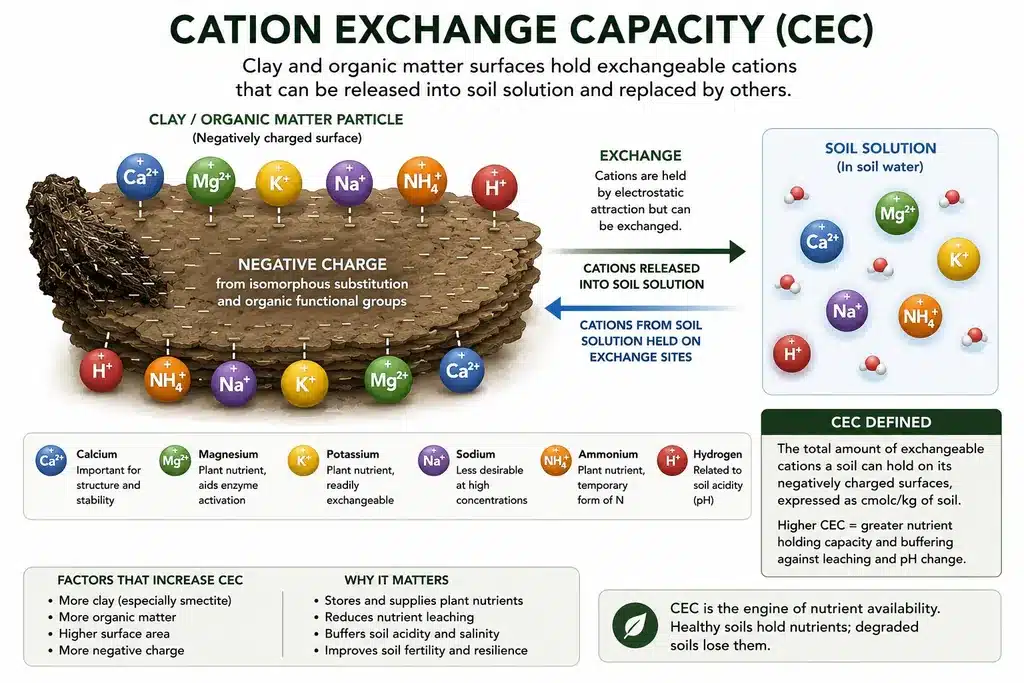
How cation exchange capacity works mechanically
Two soil components carry the negative charge that makes cation exchange possible:
- Clay minerals. The crystalline structure of clays such as smectite, vermiculite and illite carries permanent negative charge from isomorphous substitution in the silicate sheets. Kaolinite carries far less. This is why a kaolinitic tropical clay can have lower CEC than a high-OM sandy loam.
- Soil organic matter. The carboxyl and phenolic functional groups on humified organic matter ionise at typical soil pH values, contributing strong pH-dependent negative charge. Each 1% increase in organic matter typically adds 1 to 3 cmolc/kg of additional CEC.
Cations including K, Ca, Mg, Na, NH4, Al and H are held electrostatically on these negative sites. The bond is weak enough that one cation can be displaced by another when the soil solution concentration changes. This exchange process is what makes the cations plant-available rather than locked into the mineral structure.
Phosphorus is not held on the CEC because P in solution is anionic (negatively charged, as H2PO4- or HPO42-). P retention is a separate process involving anion exchange and direct chemical fixation onto iron and aluminium oxides. This is why a low-CEC sand can still hold P reasonably well even though it holds very little K.
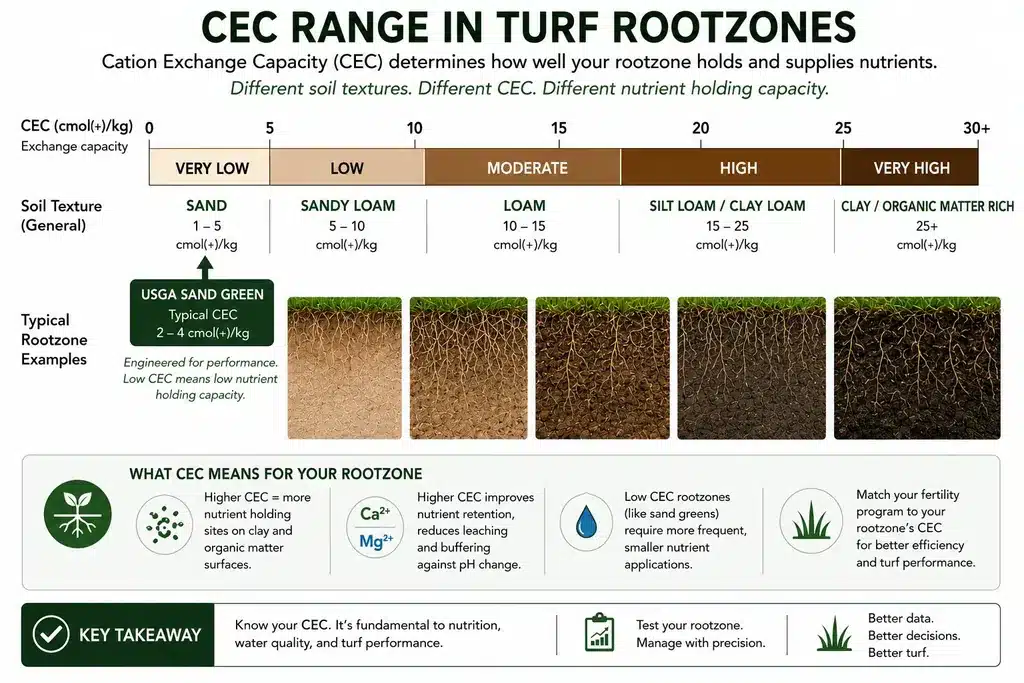
Typical CEC ranges by soil type
The following ranges describe what to expect on a standard Australian turf soil test:
| Soil or rootzone type | Typical CEC (cmolc/kg) |
|---|---|
| USGA sand greens and bowling green profiles | 1 to 4 |
| Sand-based sports field profiles | 2 to 6 |
| Sandy loam topsoil | 5 to 12 |
| Loam topsoil | 10 to 18 |
| Clay loam topsoil | 15 to 25 |
| Cracking clay (e.g. Vertosol) | 25 to 60 |
| Peat-amended organic topdressing | 30 to 80 |
The pattern is consistent: CEC rises with clay content and with organic matter content. The high traffic surfaces in sports turf and golf (sand greens, sand-capped fairways, sand-based ovals) sit at the bottom of the range because the engineered profile prioritises drainage and resistance to compaction over nutrient holding capacity. That trade-off is deliberate. The cost is that you have to manage nutrition more actively on a low-CEC profile than you would on a native clay loam.
Why USGA sand profiles run such low CEC
A USGA sand-based putting green is specified to have less than 5% silt-plus-clay by mass in the rootzone mix. The dominant component is medium sand with very limited surface area and very few exchange sites. Organic matter content is intentionally low at construction (typically 1 to 3% by mass) to keep the profile draining at the design rate.
The result is a CEC of 1 to 4 cmolc/kg in the upper rootzone. For comparison, a native clay loam under a cricket square can sit at 20 cmolc/kg or higher. The sand profile has roughly one-tenth the cation-holding capacity per unit mass.
What this means in practice:
- K leaches quickly. A 1 mm rainfall event on a USGA sand can move a significant percentage of soluble K out of the upper rootzone. Soluble K applications need to be small and frequent rather than large and infrequent.
- Ammonium is poorly retained. Without negative sites to hold NH4+, the cation is rapidly converted to nitrate by nitrifying bacteria in the well-aerated sand and then becomes leachable. This is a known limitation of urea and ammonium nitrate sources on USGA profiles, covered in our note on soil test interpretation in sand rootzones.
- pH is poorly buffered. A low-CEC rootzone shifts pH more rapidly in response to fertilisers, irrigation water quality and amendments. Lime and elemental sulphur react faster on a sand than on a clay loam.
- Calcium can drop below MLSN threshold faster than expected. Even though the construction sand often supplies adequate Ca initially, the small reserve in the exchange complex means that Ca-removing processes (clipping yield, leaching, gypsum application that releases Na exchange) can deplete it within a few seasons.
How to interpret CEC on an Australian soil test report
Australian turf labs typically report CEC alongside the individual exchangeable cations (Ca, Mg, K, Na, sometimes Al). There are two ways the CEC number may be calculated:
- CEC by summation. The lab adds the measured exchangeable Ca, Mg, K, Na and (sometimes) H and Al. This is fast and inexpensive but can overestimate CEC where soluble salts are present.
- Effective CEC (ECEC). Measured directly at field soil pH, ECEC reflects the real exchange capacity under the conditions the grass roots see. This is more accurate but more expensive.
For routine turf management the summation value is sufficient as long as you know how the lab calculated it. If you are comparing soil tests over time, make sure the same method has been used each time.
Two derived values on the soil test report draw directly from CEC:
- Base saturation percent (BS%). The proportion of CEC occupied by the basic cations Ca, Mg, K and Na. High BS% (above 75%) indicates an alkaline soil with most exchange sites filled by the desirable nutrient cations. Low BS% indicates an acid soil with H and Al occupying exchange sites instead.
- Exchangeable sodium percent (ESP). The proportion of CEC occupied by sodium. ESP above 6% indicates a sodic soil where structural problems become likely. A soil with ESP above 15% is strongly sodic. Read our note on sodium management for what to do when ESP is high.
How to manage a low-CEC rootzone
The single most effective long-term way to raise the CEC on a sand-based profile is to lift organic matter content in the upper rootzone. However, excessive organic matter build-up reduces infiltration, increases black-layer risk, and is why most surfaces need a programme of dilution topdressing and occasional core aeration. The aim is to maintain organic matter at a level that contributes to nutrient holding without limiting drainage and aeration.
Short-term management of low CEC involves:
- Smaller, more frequent fertiliser applications. Spoon-feeding nitrogen and potassium reduces leaching losses between applications. A typical greens programme on a 2 cmolc/kg sand profile might apply 5 kg N/ha every 7 to 10 days during peak growth rather than one hit at 25 kg N/ha every month.
- Slow-release or controlled-release sources. A polymer-coated urea or methylene urea source releases N over weeks rather than days, and matches the rate at which a low-CEC profile can hold and supply N. Methylene urea, IBDU, and polymer-coated ureas all sit in this category, each with different release patterns suited to different climate zones and seasonal demand profiles.
- Foliars. Bypassing the rootzone entirely for fast-acting supply via the leaf. Useful for in-season K and Mg on greens and bowling greens. Foliar K sulphate at low rates (5 to 10 kg/ha per application) sidesteps leaching losses on a sand profile, though it has to be done frequently to keep up with demand.
- Maintaining base saturation. Where Ca drops below the MLSN threshold, use calcium sources before pH and structural problems develop. On USGA sands this tends to be gypsum rather than lime. Where the sand pH is already acidic and Ca is dropping, a fine-grade ag lime or dolomitic lime is the better choice.
- Targeted topdressing. Dilution topdressing with a USGA-spec sand maintains the rootzone profile and the design infiltration rate but does nothing for CEC. Where CEC is the limiting factor, a small fraction of a higher-CEC component (typically a fine-graded zeolite or a calcined clay product) blended into the topdressing programme can lift CEC by 1 to 2 cmolc/kg over several years without compromising infiltration.
How to Decide on the Best Option
The decision between these levers depends on what is actually limiting the surface. Sand-based golf greens with deep rootzones and an active topdressing programme typically combine three or four of these tools. Sports fields and bowling greens with shallower active rootzones tend to lean more toward slow-release and foliar applications because the soil reserve is smaller.
Clay loam and clay profiles have the opposite management challenge. CEC is high, nutrient supply is good, but compaction and infiltration are typically the limiting factors rather than nutrient leaching. The soil chemistry tools you use are different. See the related notes on soil aeration and gypsum strategy for those situations.
CEC and the bigger picture of soil and rootzone science
CEC is one of three foundational soil-chemistry numbers that drive turf nutrition decisions, alongside pH and organic matter content. The MLSN interpretation framework provides the threshold against which individual nutrients are read, but CEC tells you how long the soil can hold those nutrients between fertiliser applications. A sand profile at 2 cmolc/kg needs a fundamentally different programme to a clay loam at 18 cmolc/kg even when the nutrient analysis numbers look similar on paper.
For the threshold side of soil test interpretation, read the MLSN interpretation guide. For the broader context covering rootzone construction, aeration, organic matter, and irrigation, the soil and rootzone science pillar is the parent reference.
References
- Carrow, R.N., Waddington, D.V. and Rieke, P.E. (2001). Turfgrass Soil Fertility and Chemical Problems. John Wiley and Sons.
- Culman, S., Mann, M., Sharma, S., Saeed, M.T., Fulford, A.M. and Lindsey, L.E. (2021). Calibration of Mehlich-3 with Bray P1 and ammonium acetate in the Tri-State Region of Ohio, Indiana and Michigan. Communications in Soil Science and Plant Analysis, 52(2), 141-155.
- Kopittke, P.M. and Menzies, N.W. (2007). A review of the use of the basic cation saturation ratio and the “ideal” soil. Soil Science Society of America Journal, 71, 259-265.
- Stowell, L. and Woods, M. (2014). Only what the turf needs: updating the Minimum Levels for Sustainable Nutrition guidelines. Crop Science Society of America annual meeting, November 2014.
- Woods, M.S., Stowell, L.J. and Gelernter, W.D. (2016). Minimum soil nutrient guidelines for turfgrass developed from Mehlich-3 soil test results. PeerJ Preprints, 4:e2144v1.
Part of the Soil and Rootzone Science series.

Principal agronomist, Gilba Solutions Pty Ltd
BSc Hons Soil Science (Newcastle). Former STRI agronomist. Author of Nutrition of Sports Turf in Australia (CSIRO/Landlinks Press) and The Definitive Guide to Australian Turfgrass Pesticide Management. 35+ years advising on sports turf, golf and stadia across Australia, NZ, UK and Europe.