THE GAIP HUB: MAKE THE RIGHT CALL, ON THE RIGHT DAY
The GAIP Hub is a turf management decision platform built to help manage surface performance. It combines disease forecasting, soil and tissue interpretation, water chemistry, PGR scheduling and spray tracking into a single system so decisions are based on current conditions, not calendar timing.
Spray too early and you waste product. Spray too late and you lose control. Push nitrogen without any context and you drive disease. Miss a PGR timing and growth gets away from you.
Every output traces to peer-reviewed research. No made up thresholds. No product bias.
Developed by Jerry Spencer. Senior Agronomist, Honours Soil Science, 35+ years industry experience.
Disease Decision Support
Know when risk becomes action.
The GAIP Hub runs sixteen validated disease models against real-time weather data from your site. It identifies when conditions exceed actual infection thresholds, not just trends.
The system covers dollar spot, brown patch, Pythium blight, anthracnose, fusarium, grey leaf spot, spring dead spot, red thread, large patch, take-all patch and more.
Each model uses species-specific risk scores with regional fungicide recommendations. This integrates with your spray history so you know what residual protection remains.
Outputs help you make better decisions:
- Early warning of disease pressure before you see any symptoms.
- Suppression of false positives under marginal conditions.
- Clear spray windows based on current and forecast risk.
- Residual tracking from previous applications.
Result: fewer unnecessary sprays, better timing, and defensible decisions.
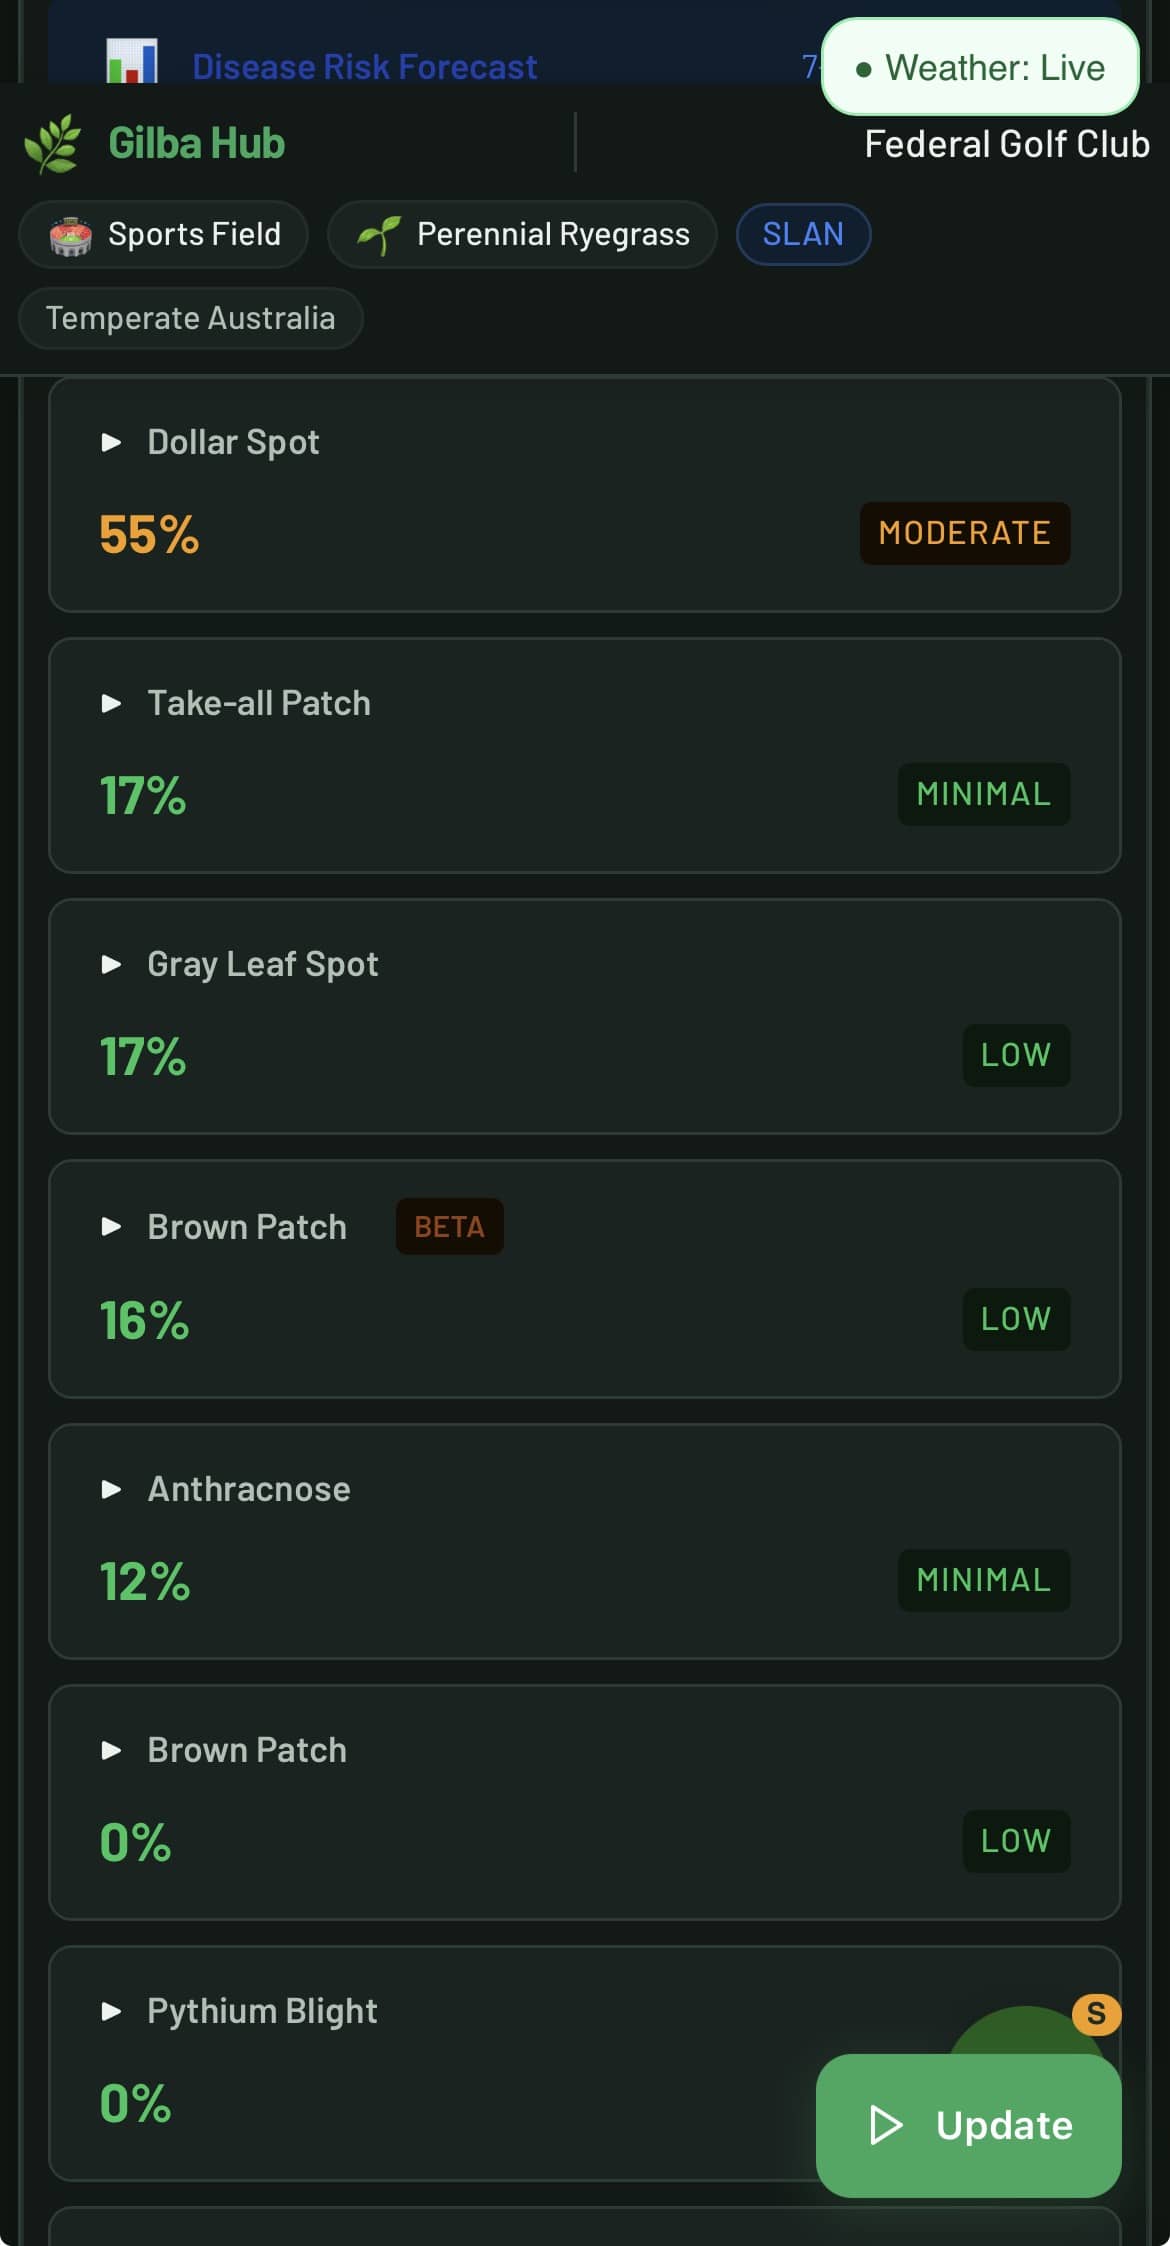
The disease risk forecast interface on the GAIP hub.
How does the Smith-Kerns dollar spot model work?
The Smith-Kerns model (2018) uses concurrent-condition hours: relative humidity above 90% and temperatures between 15 to 30°C must occur simultaneously. This matches the original methodology and eliminates false alerts from marginal conditions. Because both thresholds must be met at the same time, you get accurate early warning rather than noise from single-variable triggers.
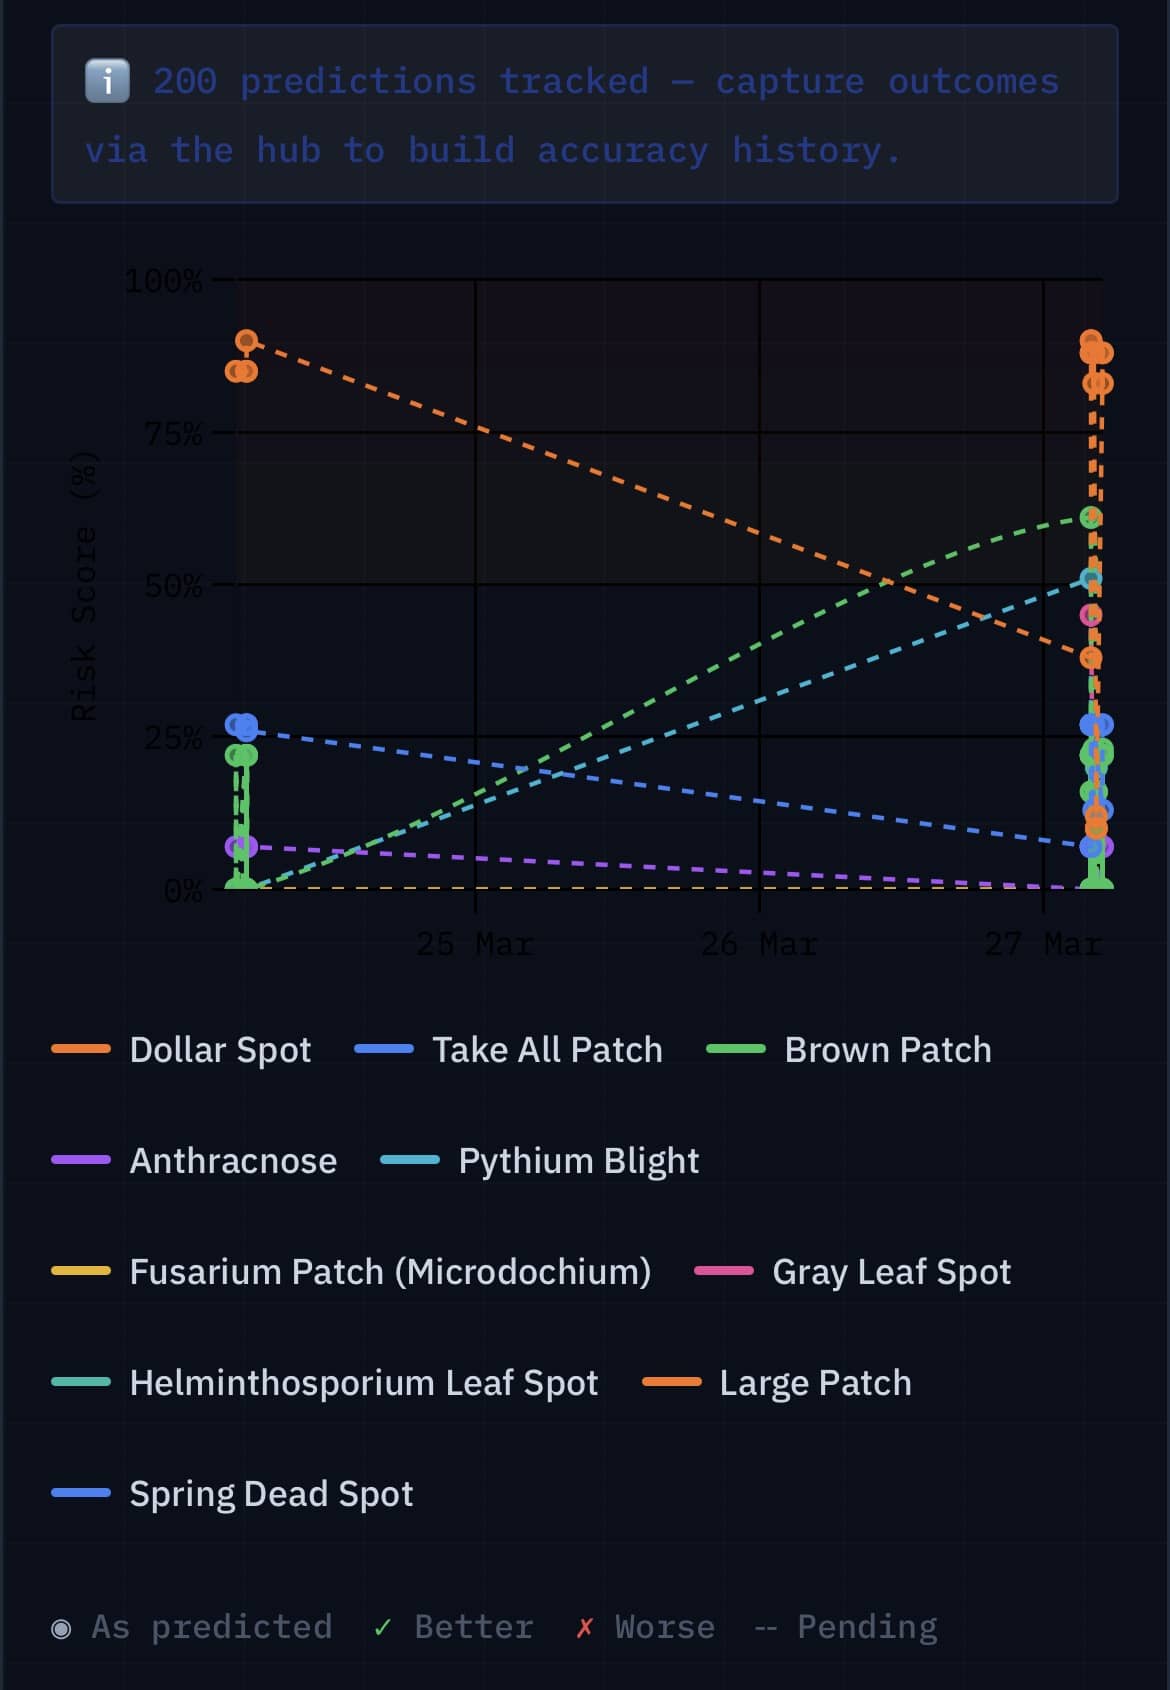
The GAIP Hub tracks disease predictions.
Soil, Tissue and Nutrition Interpretation with the GAIP Hub.
Identify what actually limits turfgrass performance.
The soil nutrient model is built on MLSN (Stowell, Gelernter & Woods) as the unmodified baseline. SLAN is supported for sand and native soil profiles, and ammonium acetate for Hill Labs NZ reports. These are alternative test methods, not separate frameworks.
The model then converts MLSN targets into a site-specific program in two layers. Demand scaling: growth potential (Gelernter & Stowell) and Kussow et al. 2012 threshold adjustment above ~200 kg N/ha/yr. Delivery constraints: water quality (Ayers & Westcot; Carrow & Duncan) and CEC govern rate, timing and splits. The target is not shifted, only how it is met.
A supplier dropdown then lets you choose the product you want to apply.
For high-input programs above 200 kg N/ha/year, the Hub applies an N-driven threshold adjustment (Kussow et al. 2012). This takes into account increases in nutrient demand under heavy nitrogen use.
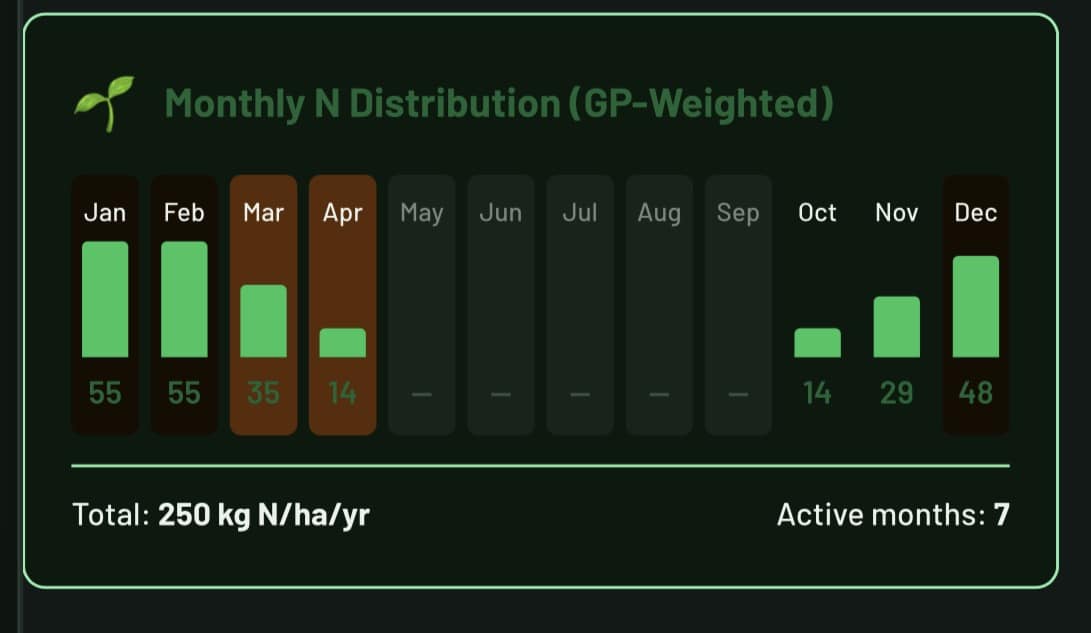
Image showing how the GAIP Hub shows monthly nitrogen distribution. This is a couch site in Canberra with 7 months active growth.
Outputs focus on:
- True deficiencies vs uptake limitations.
- How nutrient antagonisms affect nutrient availability (K interacts with Mg, Ca interacts with Mg, P interacts with Zn, Fe interacts with Mn).
- Excessive build up and luxury consumption.
- The hub is able to adjust turf requirements under high nitrogen programs.
Result: target your inputs instead of blanket fertiliser programs.
How does soil-tissue cross-validation work?
By having species-specific sufficiency ranges. These drive any cross-validation between what’s in the soil and the plant uptake.
The Hub diagnoses whether a tissue deficiency is a result of a genuine soil shortage, an uptake constraint (pH, antagonism, root zone issue), or luxury consumption.
It also links tissue nutrient status directly to disease susceptibility, and then connects lab results to field risk.
Additional Soil Diagnostics
- Organic matter (LOI) at three depths: 0–2 cm, 2–4 cm, 4–6 cm.
- Sodium assessment with gypsum rate recommendations.
- Sulphur acidification calculator.
- CEC evaluation from very low (<3 meq/100g) through to high (>15 meq/100g).
- Upload a soil, water or tissue report as a PDF and the Hub populates all fields automatically.
PGR and Spray Timing
Track when regulation ends, not when the label says it might.
The GAIP Hub models PGR performance. It does this bu using simplified sinewave models based on the Kreuser framework (Kreuser & Soldat 2011; Kreuser 2017), with species-specific rebound or no-rebound behaviour.
Trinexapac-ethyl, paclobutrazol, and prohexadione-calcium each have their own decay curves calibrated by active ingredient and mowing height. Ethephon is handled separately as a GDD-timed seedhead suppression tool, not a decay model. This is because its mechanism of action (ethylene release) does not produce the same suppression-rebound cycle.
Reapplication timing depends on accumulated growing degree days, which vary by species and base temperature. Cool-season (C3) grasses use a 0°C base because growth continues near freezing. Warm-season (C4) grasses use a 10°C base. This is the approximate threshold below which C4 photosynthesis becomes minimal.
Trinexapac-ethyl reapplication thresholds (greens cut turf)
| Species | GDD Threshold | Base Temp | Evidence | Source |
|---|---|---|---|---|
| Creeping bentgrass | 200 GDD | 0°C | Published | Kreuser & Soldat 2011 |
| Ultradwarf bermudagrass | 220 GDD | 10°C | Published | Reasor et al. 2018; Carroll et al. 2022 |
| Couch / common bermudagrass | 240 GDD | 10°C | Estimated | Extrapolated from ultradwarf data |
| Perennial ryegrass | 250 GDD | 0°C | Estimated | No published GDD study for ryegrass |
| Kentucky bluegrass | 200 GDD | 0°C | Estimated | Extrapolated from bentgrass; Kreuser notes model is species-specific |
| Kikuyu | 200 GDD | 10°C | Operational | No peer-reviewed curve; calibrated from field programmes |
| Zoysia | 260 GDD | 10°C | Low confidence | Ledford 2019 (Diamond zoysia, conference level) |
Thresholds increase with mowing height. The hub applies surface multipliers for tees, fairways, sports turf, and rough, scaling from the greens baseline.
Paclobutrazol and prohexadione-calcium thresholds (greens cut turf)
| Active ingredient | Species | GDD Threshold | Base Temp | Evidence | Source |
|---|---|---|---|---|---|
| Paclobutrazol | Creeping bentgrass | 285 GDD | 0°C | Published | Kreuser et al. 2018 (269–302 GDD range) |
| Prohexadione-Ca | Creeping bentgrass | 300 GDD | 0°C | Published | Kreuser 2015; Nufarm label 280–350 GDD |
| Prohexadione-Ca | Ultradwarf bermudagrass | 95 GDD | 10°C | Published | Reasor et al. 2018 (peak suppression 92–97 GDD; reapplication 120–126 GDD) |
Ethephon (seedhead suppression timing)
Ethephon is not modelled as a decay curve. The Hub tracks GDD accumulation from a seasonal biofix and triggers application windows at species-specific thresholds. It also supports autumn pre-loading and sequential spring applications.
Evidence key: Published = peer-reviewed data for that species and active ingredient. Operational = calibrated from field programmes without peer-reviewed validation. Estimated = extrapolated from related species or mowing height adjustments. Low confidence = conference-level data or limited research only.
Outputs
The module reports remaining growth regulation as a percentage. The basis of reapplication timing is actual GDD accumulation at the site, and this integrates with the spray diary to maintain a full application history. The result is consistent control with fewer mistimed applications.
What happens when PGRs and DMI fungicides overlap?
When you use DMI fungicides alongside PGRs, their combined growth suppression can exceed what either product produces alone. Kreuser’s lab has documented this compounding effect and developed combined models to predict multi-product suppression.
The GAIP Hub tracks this interaction and triggers warnings when combined suppression exceeds 35%, 50%, or 70%. Most spray programmes fail to account for this stacking effect, which is a common cause of collar decline and over-regulation on greens.
Spray Diary and Residual Protection
Log every application: fungicide, PGR, herbicide, fertiliser and wetting agent. The spray diary calculates residual protection using three decay pathways:
- Temperature-adjusted decay (Q10 = 2.58, EFSA 2007).
- Rainfall washoff (Willis et al. 1996) and
- UV photolysis degradation from solar radiation exposure.
This matters because when you apply a contact fungicide on a clear, high-radiation day, it breaks down faster than the label interval assumes.
The Hub accounts for this so your residual protection estimate reflects what actually happens on the leaf, and not what the label claims.
- 44 active ingredients with APVMA (AU) and ACVM (NZ) registered re-application intervals.
- FRAC rotation warnings flag consecutive group use.
- DMI overuse alert triggers at three or more applications within 90 days.
Water Quality and Soil Structure
Understand how water is changing your soil.
Built on Ayers & Westcot (FAO Irrigation and Drainage Paper 29 Rev. 1, 1985) for irrigation suitability classification and Carrow & Duncan (2012) for turfgrass-specific salinity and sodic soil thresholds.
The engine analyses salinity, sodicity and alkalinity using adjusted SAR with Gapon ESP, residual sodium carbonate, infiltration hazard assessment, and a leaching requirement calculation. These drive downstream impacts on nutrient availability, soil structure and disease pressure.
For sites using multiple water sources, the Hub blends bore, mains and recycled water to calculate combined quality impacts.
Outputs translate chemistry into what actually happens in the field:
- Infiltration risk and soil structure decline.
- Nutrient availability effects driven by water quality.
- Blended water source analysis
Result: proactive management of soils and the impact of irrigation water.
The GAIP Hub For Pre-Emergent Herbicide Timing
How does GAIP Hub time pre-emergent applications?
The GAIP Hub uses first-order decay kinetics with Q10 temperature corrections to predict barrier breakdown based on accumulated growing degree days.
The system automatically flags the autumn timing window when soil temperatures decline through the 26°C Poa annua germination threshold. A split-card UI displays autumn and spring timing as separate recommendation blocks.
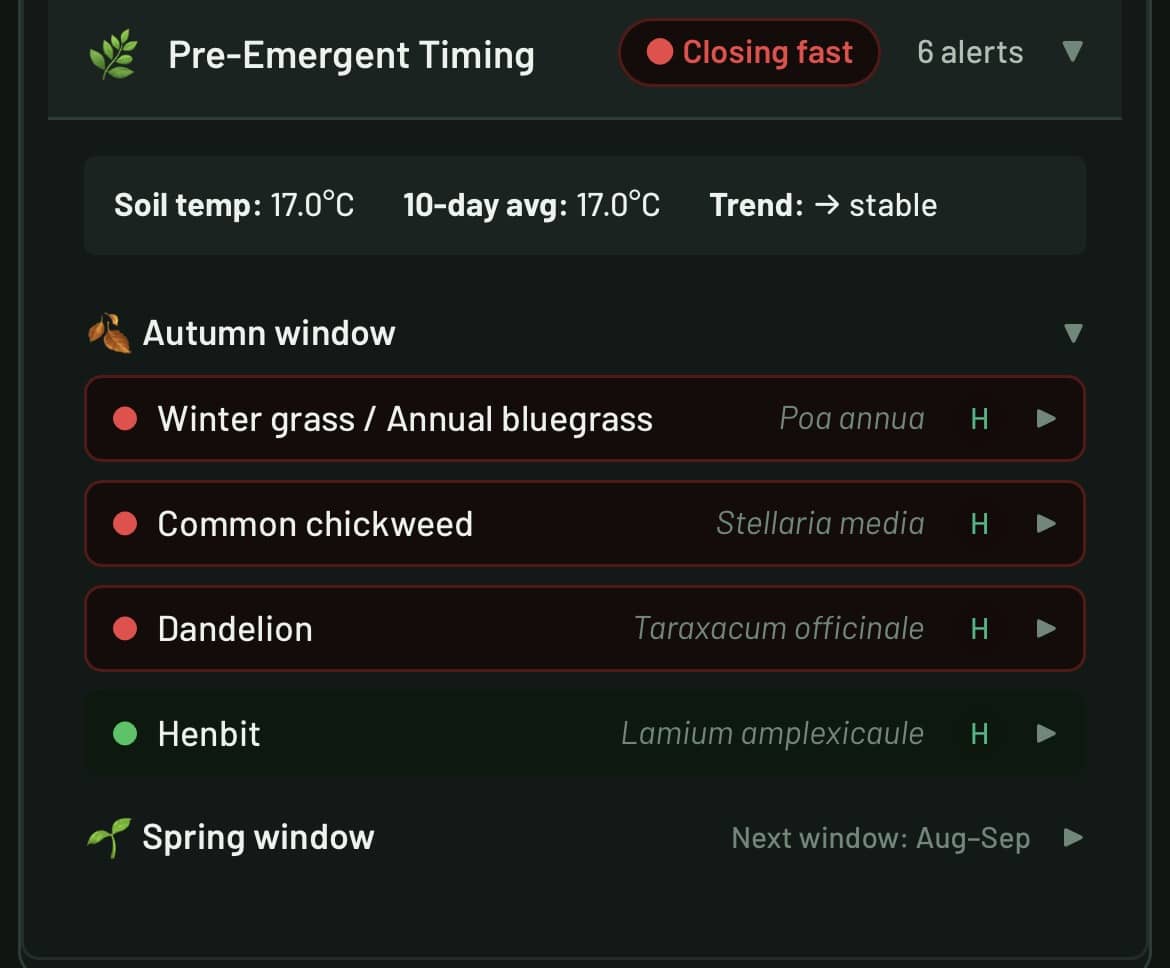
The GAIP Hub has clear easy to read interface for pre-emergent timing.
Growth Potential and Climate Integration
How does the GAIP Hub calculate growth potential?
Growth potential tells you how actively your grass is growing right now. It is based on the air temperature and species type. The GAIP Hub uses the Gelernter and Stowell Gaussian models (PACE Turf) with a C3 optimum of 20°C and C4 optimum of 31°C, plus mixed-stand weighting for overseeded surfaces.
Real-time weather data comes from the Open-Meteo API, providing a 14-day forecast and 90-day historical lookback for your site location. A dew prediction engine (Jacobs et al. 2008, Monteith 1957) feeds leaf wetness hours directly into the disease models.
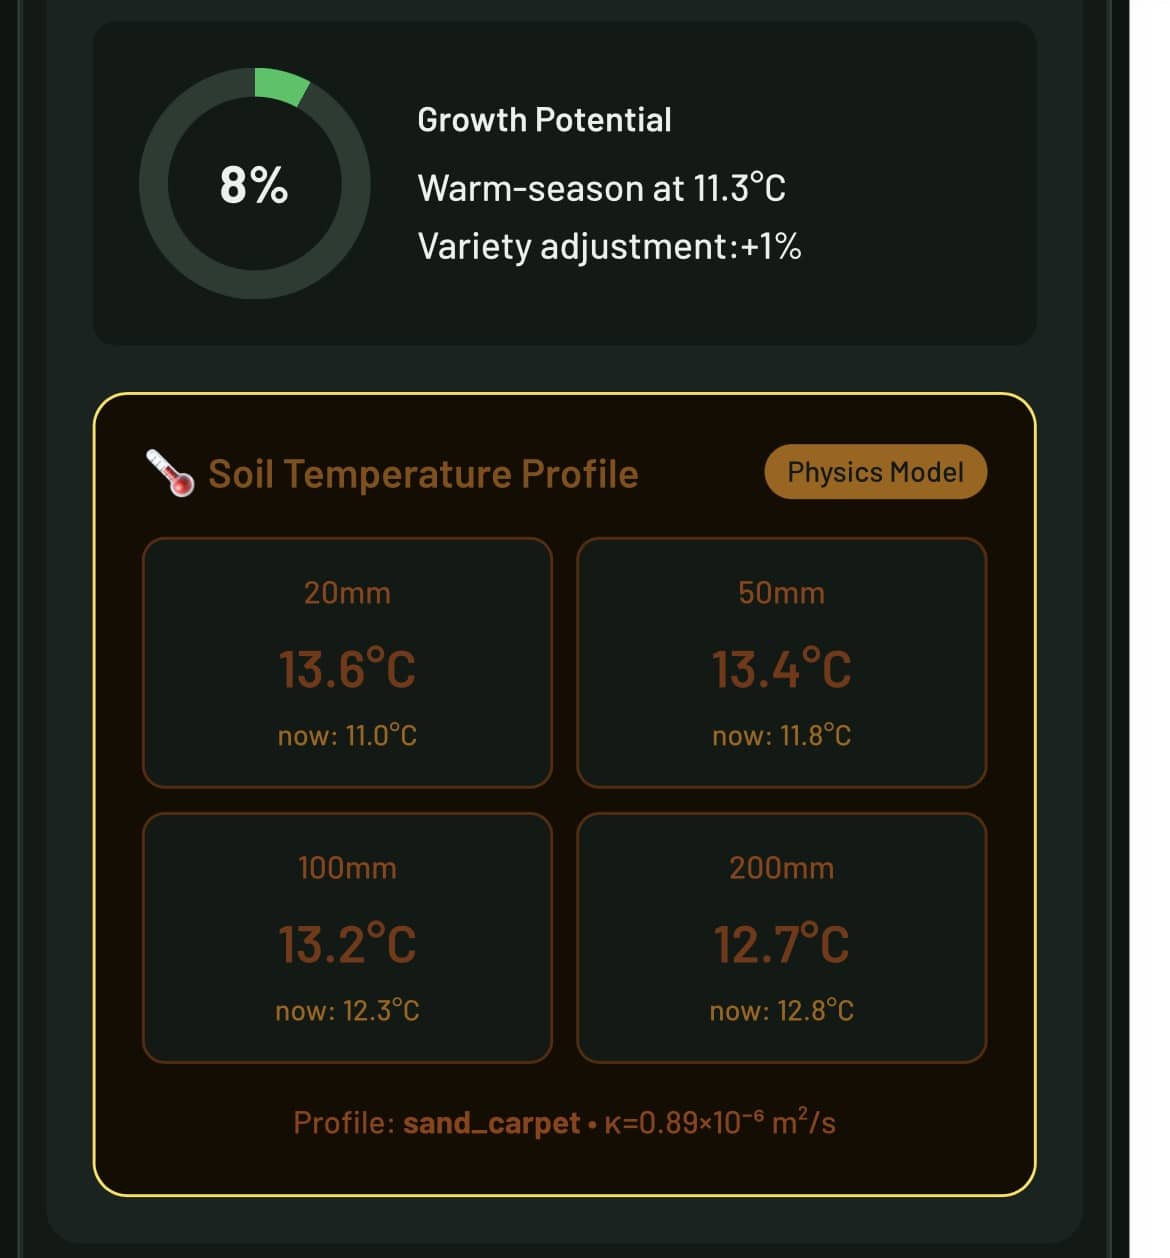
Growth potential gauge and soil temperature profile at four depths on a sand carpet construction.
Supporting Systems
Other modules extend decision depth without any increase in complexity:
Stadium Shade and LED Analysis (The GSSH Hub)
- Shadow path calculations for 77+ venues across the AFL, A-League, Premier League, Championship, J1 League and international stadiums.
- 12-month DLI trajectories by zone with LED supplemental lighting recommendations.
- Ambient DLI calculated from solar radiation data (DLI = Solar Radiation MJ/m² × 2.057).
Sensor Data Integration
- Direct CSV import from TDR FieldScout 350 and POGO soil moisture sensors.
- Live API integration with Hydrosight wireless monitors reading VWC, soil temperature and salinity.
- Site-scoped sensor assignments with automatic staleness detection.
Scenario Comparison
- Save up to 10 What-If scenarios and compare them side-by-side.
- Presets cover MLSN versus SLAN, gypsum remediation, and water blend changes.
- Confidence scoring tracks input quality and forecast degradation.
Reporting and Export
- Word document reports with colour-coded status indicators, priority actions sorted by timeframe, embedded charts, cultivar performance profiles, and full methodology citations.
- Every run creates a unique Run ID with complete input capture and a forensic decision record.
AI-Powered Cross-Module Interpretation
Analyses patterns across soil, water and tissue data. Identifies interactions individual engines cannot detect: water quality impacts on nutrient uptake, tissue results that contradict soil sufficiency, and water-driven sodicity that increases disease risk.
Regional Cultivar Database
Species-specific variety traits drawn from six international databases. These cover disease resistance, wear tolerance, texture, colour and regional performance. The database covers 450+ varieties across all major turfgrass species.
| Region | Database | Coverage |
| USA / AU / NZ | NTEP | 200+ varieties across 10 species |
| UK / Ireland | BSPB Turfgrass Seed 2025 | 150+ varieties (STRI Bingley trials) |
| Scandinavia | Scanturf | 100+ varieties in Nordic climates |
| France | GEVES | French variety registration data |
| Germany | BSA Rasengräser 2025 | German variety performance data |
| Japan | MAFF/NTEP-Japan | J-League adapted varieties |
Variety selection integrates with disease resistance scoring. High-risk cultivars receive an adjusted disease pressure rating. Word export includes a cultivar performance profile for the selected species and region.
Who Is GAIP Hub For?
Golf course superintendents, sports turf managers, and agronomic consultants who manage one or more sites. The Hub currently serves clients across Australia, New Zealand, the United Kingdom, Ireland, Scandinavia, Europe and Japan.
| Region | Regulatory Body | Product Coverage |
| Australia | APVMA | 38+ active ingredients, 60+ products |
| New Zealand | ACVM/MPI | 28+ active ingredients, NZ-specific |
| UK / Ireland | HSE/CRD | MAPP numbers, approved uses |
| Scandinavia | KEMI, Danish EPA, Mattilsynet | Regional registrations |
| Europe | ANSES, BVL, MAPA | France, Germany, Spain |
| Japan | MAFF | Golf and sports field registrations |
The Evidence Standard
Every calculation in the GAIP Hub traces to a named, published source. If a number cannot be sourced to published research, it is not in the Hub.
If a number cannot be sourced to published research, it is not in the Hub. A selection of the core references is shown below; the full bibliography is in the methodology documentation.
- Smith-Kerns (2018). Dollar spot concurrent-condition model.
- Kreuser & Soldat (2011). GDD thresholds for PGR reapplication.
- Reasor et al. (2018). Ultradwarf and bermuda GDD thresholds.
- EFSA (2007). Q10 temperature correction for residual decay.
- Willis et al. (1996). Fungicide rainfall washoff.
- Gelernter & Stowell (PACE Turf). Growth potential Gaussian models.
- Jacobs et al. (2008), Monteith (1957), Garratt & Segal (1988). Dew prediction.
- Kussow et al. (2012). N-driven MLSN threshold adjustment.
- Woods, Stowell & Gelernter (PACE Turf). MLSN guidelines.
- Ayers, R.S. & Westcot, D.W. (1985). Water Quality for Agriculture. FAO Irrigation and Drainage Paper 29 Rev. 1. Rome.
- Carrow, R.N., Duncan, R.R. (1998). Salt-Affected Turfgrass Sites: Assessment and Management. Ann Arbor Press, Chelsea, MI. ISBN 1-57504-091-3.
Operational Outcomes
The GAIP Hub changes how decisions are made:
- Reduces unnecessary fungicide and PGR applications.
- Improves timing precision.
- Identifies limiting factors before you see any visible decline.
- Builds a defensible, recorded decision framework.
The result is better surface performance with more control over inputs.
Ready to Get Started?
Access to the GAIP Hub is by subscription. Contact us to discuss your site requirements.
Start with a Site AssessmentWhat sensors does GAIP Hub work with?
Direct CSV import from TDR FieldScout 350 and POGO soil moisture sensors. Live API integration with Hydrosight wireless monitors. Site-scoped sensor assignments include automatic staleness detection.
How does GAIP Hub differ from other turf management tools?
Every recommendation traces to peer-reviewed research. The platform integrates disease forecasting, soil chemistry, PGR scheduling, spray history and water quality into a single system rather than treating them as separate tools. It was built by an independent agronomist with 35+ years of experience, not a software company.
Can I upload my lab reports directly?
Yes. Upload soil, water or tissue reports as a PDF and GAIP Hub automatically populates the relevant analysis fields.
What countries does GAIP Hub cover?
GAIP Hub serves turf managers in Australia, New Zealand, the United Kingdom, Ireland, Scandinavia, France, Germany, Spain, and Japan. Fungicide databases use region-specific regulatory registrations (APVMA, ACVM, HSE/CRD, KEMI, ANSES, BVL, MAPA, MAFF).
What turf species does GAIP Hub support?
GAIP Hub covers all major turfgrass species including creeping bentgrass, bermuda/couch, perennial ryegrass, Kentucky bluegrass, kikuyu, zoysia, and fine fescue. Species-specific parameters drive disease models, PGR thresholds, and growth potential calculations.
Principal agronomist, Gilba Solutions Pty Ltd
BSc Hons Soil Science (Newcastle). Former STRI agronomist. Author of Nutrition of Sports Turf in Australia (CSIRO/Landlinks Press). 35+ years advising on sports turf, golf and stadia across Australia, NZ, UK and Europe.